Installing GDB
Its already present in Kali’s repo. So can install it simply using apt.
sudo apt install gdbInstalling Plugins
There are some specific plugins to use the gdb tool with a more understandable user interface. One of them is the PEDA (Python Exploit Development Assistance) plugin. This plugin provides a more colorful and more understandable interface to the user during debugging.
PEDA (Python Exploit Development Assistance)
You can checkout the plugin’s GitHub repository for the steps of installation or can use the following one liner.
git clone https://github.com/longld/peda.git ~/peda && sed -i 's/set logging on/set logging enabled on/g' ~/peda/peda.py && sed -i 's/set logging off/set logging enabled off/g' ~/peda/peda.py && echo "source ~/peda/peda.py" >> ~/.gdbinit && rm ~/peda/lib/six.py && sudo apt install python3-six && echo "DONE! debug your program with gdb and enjoy"These syntax warnings are harmless. PEDA must be working fine, if you get that gdb-peda$ prompt. You are getting these warning because PEDA is relatively old.
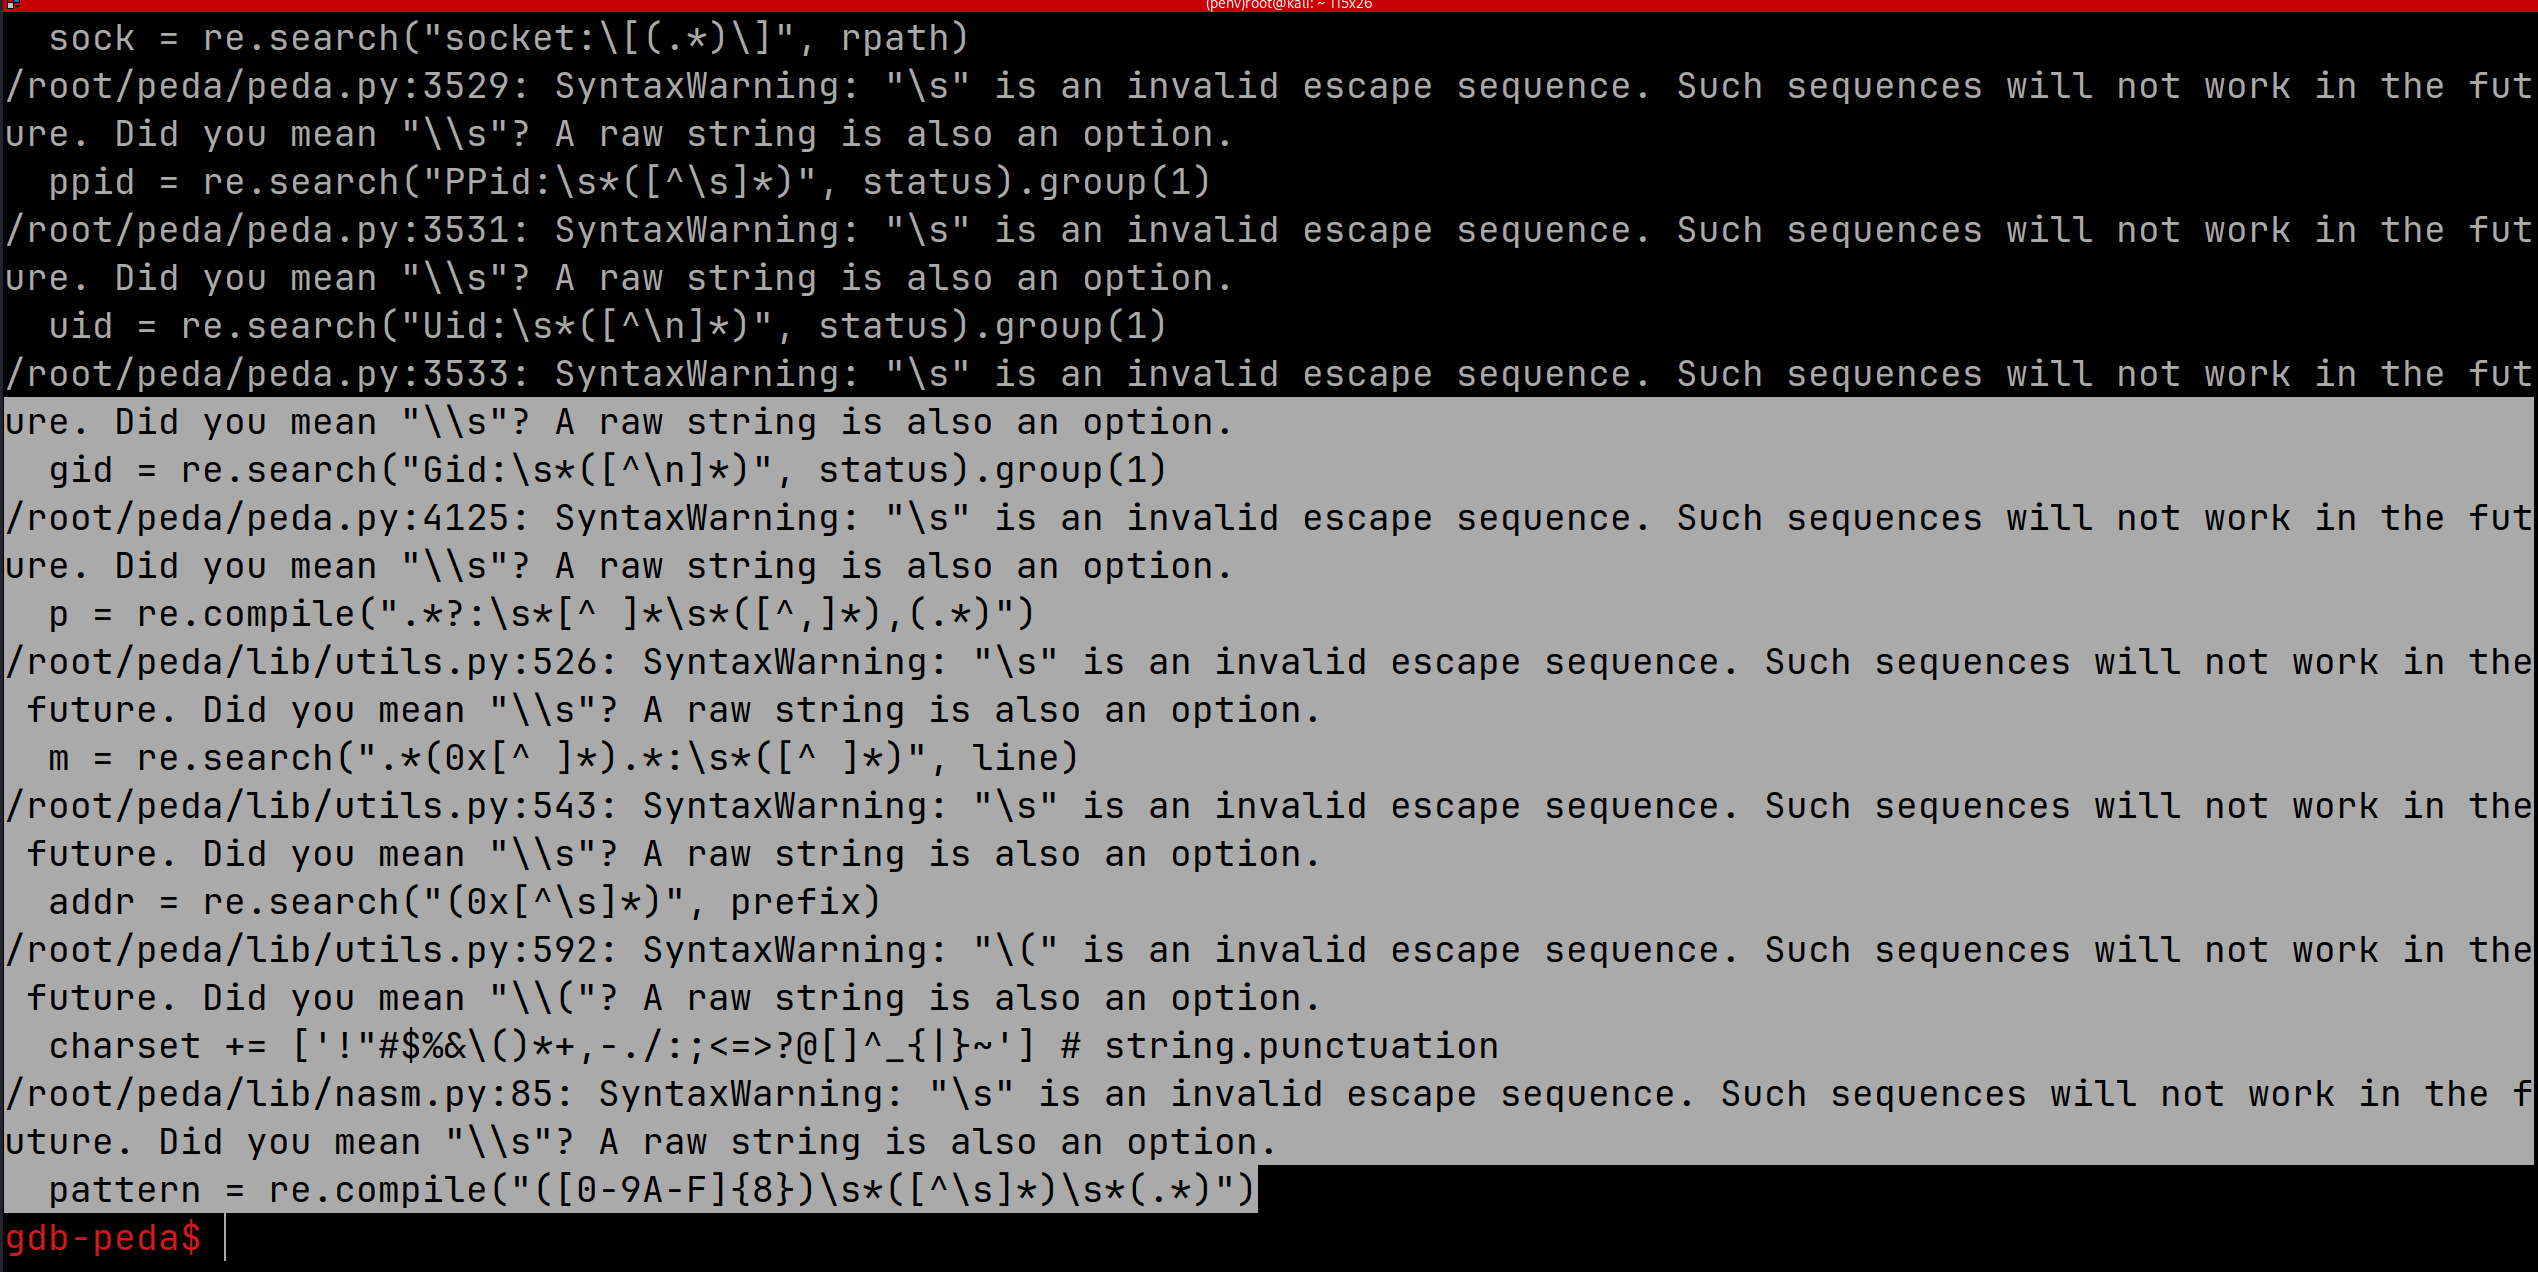
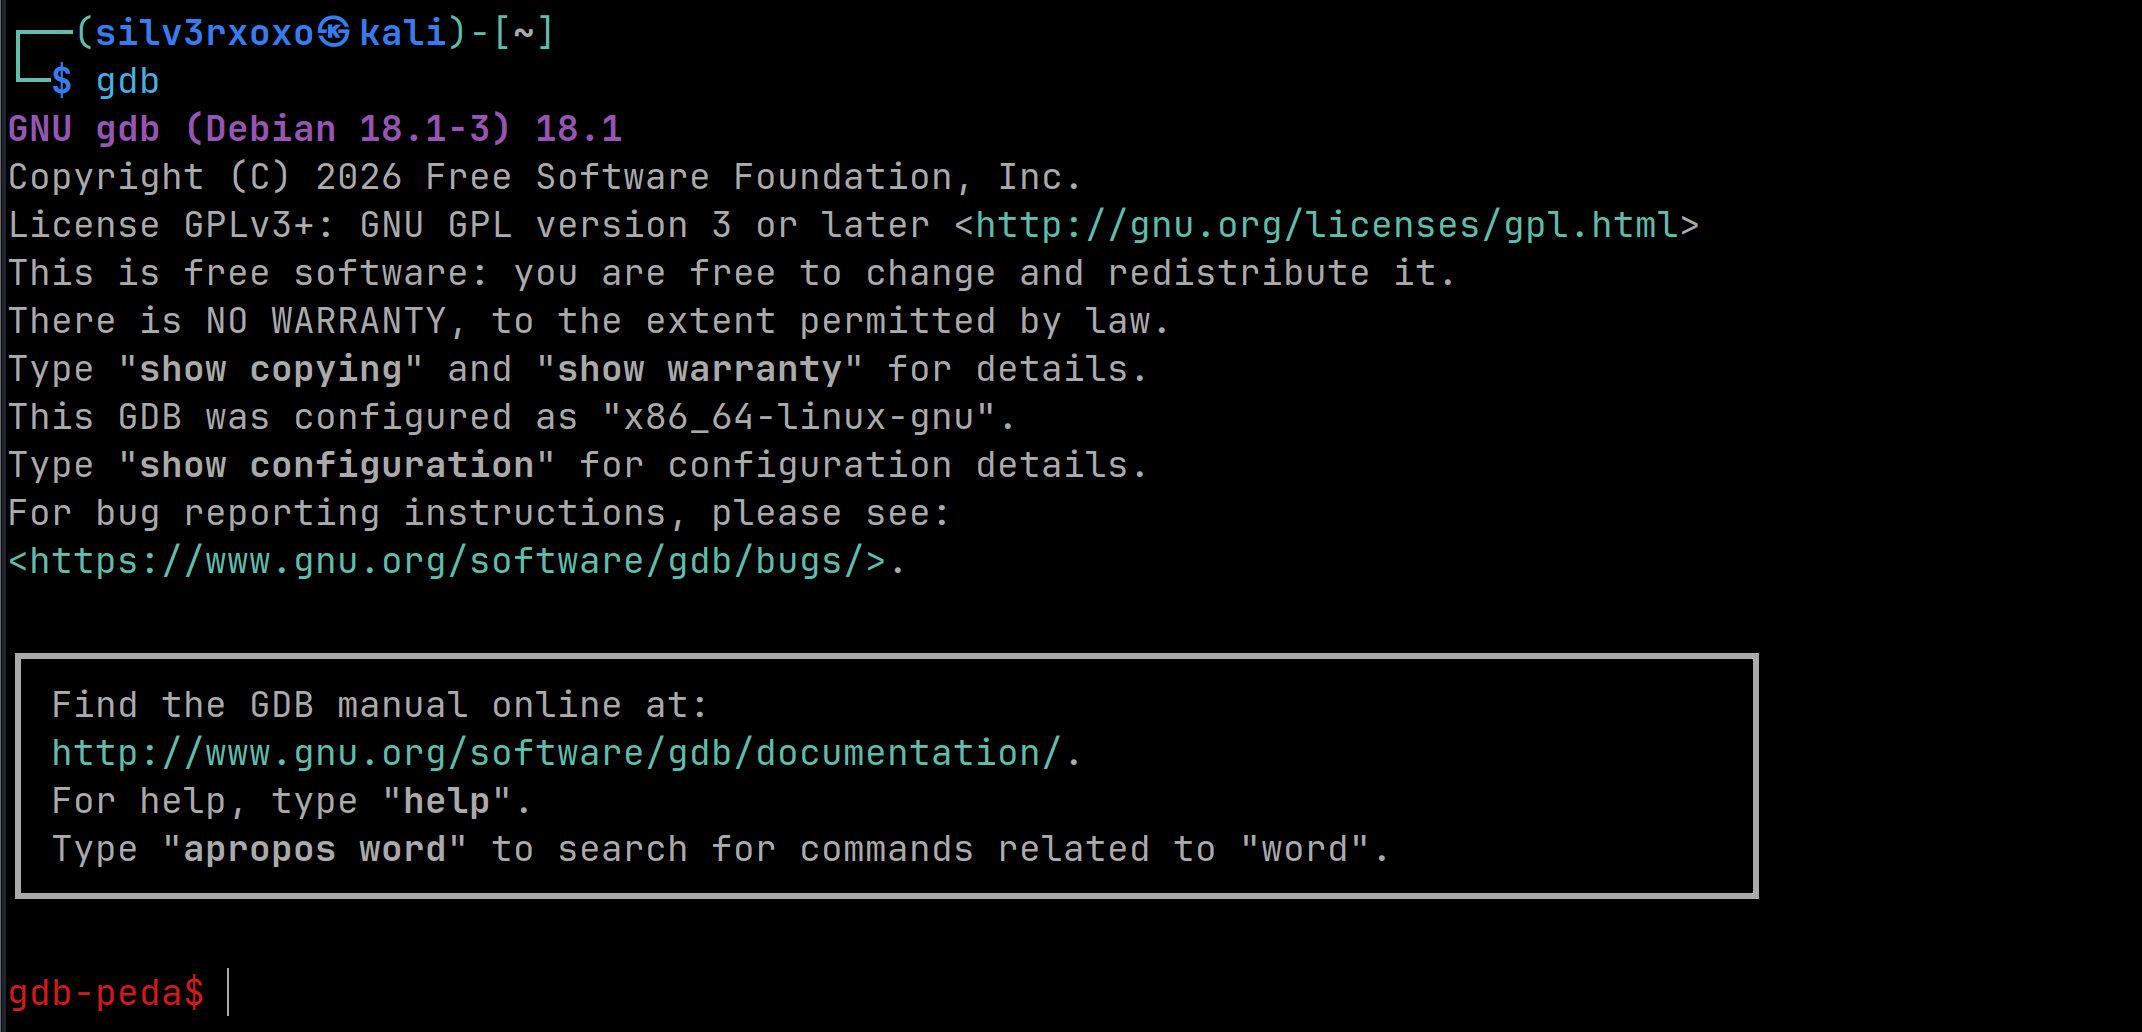
You can remove these warning as well by editing your ~/.gdbinit file. Add the following snippet just above the source ~/peda/peda.py line.
python
import warnings
warnings.filterwarnings("ignore", category=SyntaxWarning)
end
Then it will look clean.
Basic GDB commands
file
The file to be debugged is given to the program with the below file command
file file_nameinfo
The info command is that the one that provides information in accordance with the given parameter
info functionsbreak (b) command
This command is used to set breakpoint. The break command can be given an address or a function name as a parameter.
break main
*sign is prefixed to the address when setting breakpoints to memory addresses.
run command
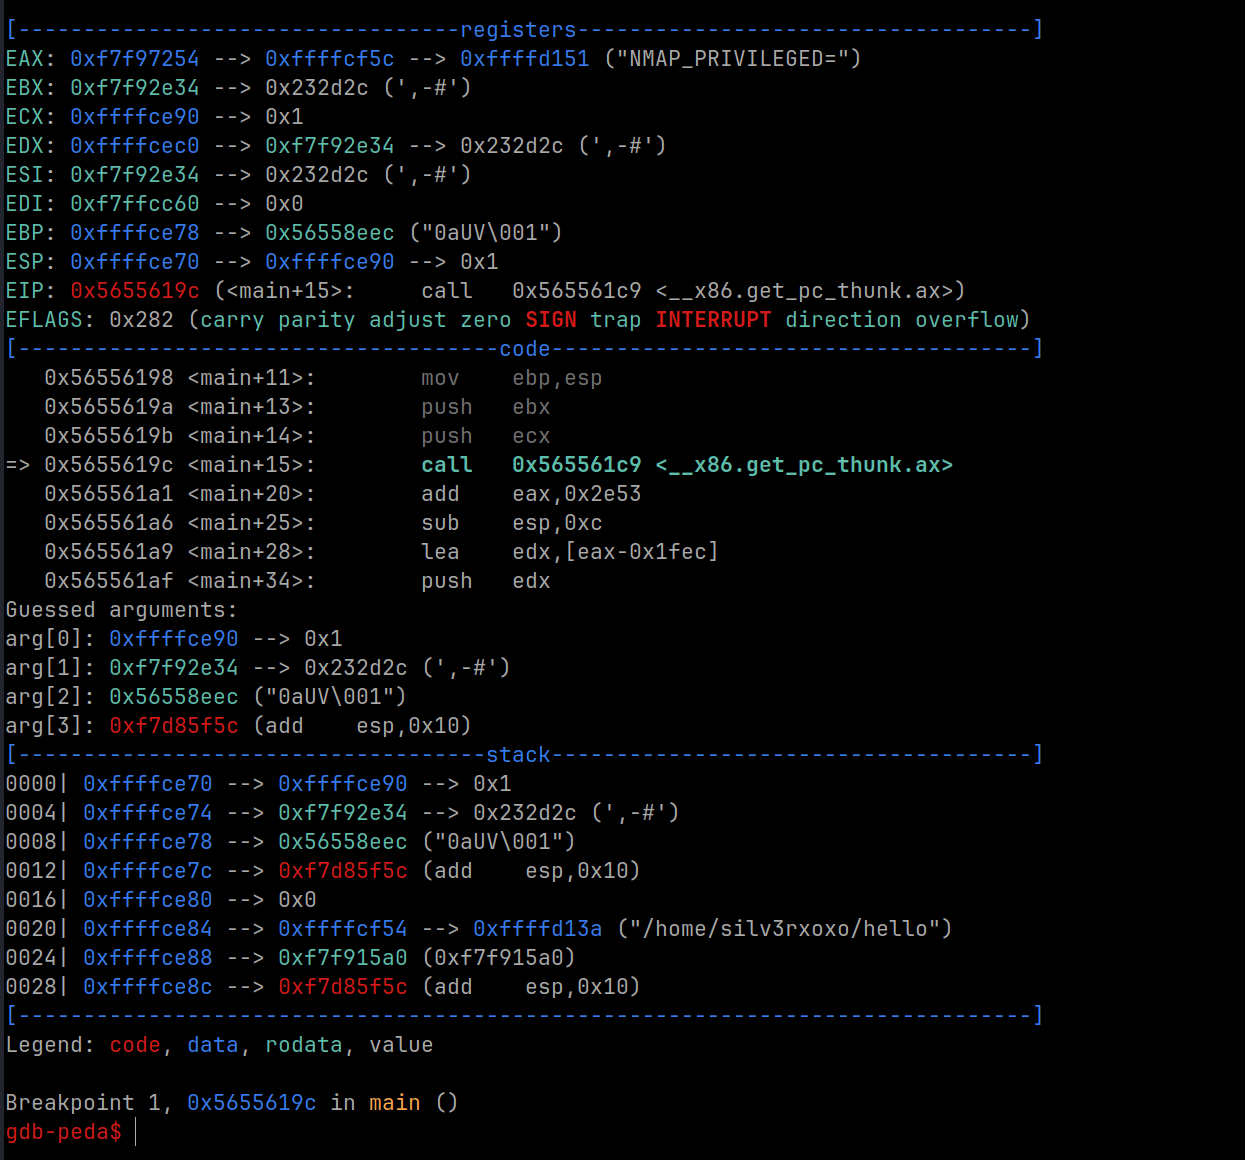
The program is executable after the breakpoint is set. Run command is used to “run” the executable. There are 3 sections on the screen:
- Registers : It displays the current values of the registers after each instruction execution.
- Code : It is the field where the executed instructions in the program flow are located.
- Stack : It is the field where the elements in the stack data structure are displayed.
Nexti (ni) and Stepi (si)
A single instruction is executed with thenexti(ni)command and changes are applied to the relevant register or data fields. With this command will not enable us to get into the functions called with the call instruction. If the next instruction to be executed is “call” and it is needed to get into the called function, thestepi(si) command should be executed.
continue (c)
it executes the instruction up to the next breakpoint. it can also be used with the alias c.
set
it is used to set the value of registers
set $eip=0x565561bb
When assigning values to registers, a
$sign must be prefixed the register name in the command.
context
It is used to display the current information on the debugging screen.
quit (q)
it is used to exit the GDB.